![]()

Mastering Support and Resistance Levels in Forex
Understanding support and resistance levels in Forex
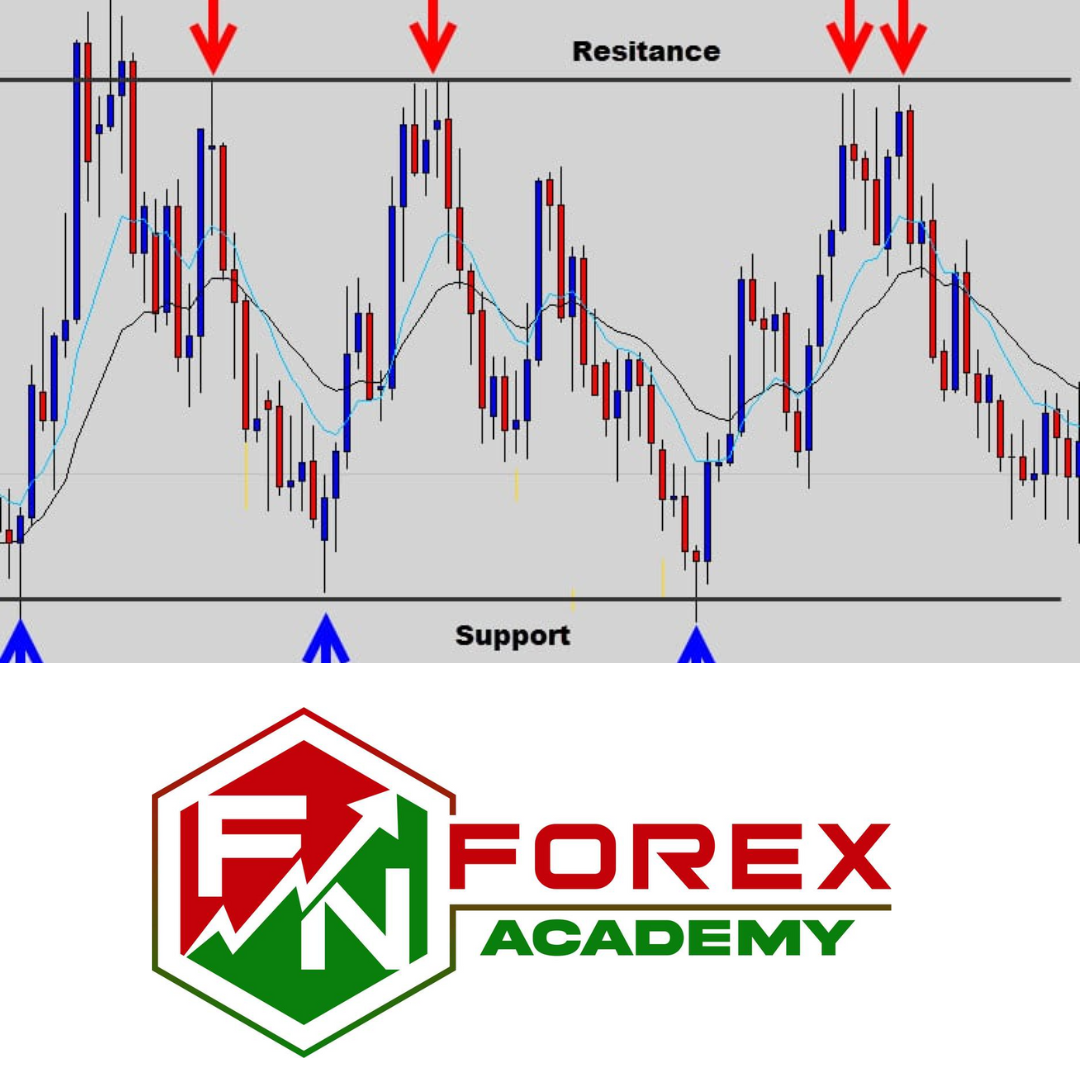
Support and resistance levels in Forex trading represent Key levels where the forces of supply and demand meet. These levels are foundational for traders to understand market sentiment and price movements. At its core, a support level is where the price tends to find a floor, stopping from falling further, indicating a surplus of buyers. Conversely, a resistance level is where the price seems to hit a ceiling, ceasing to rise higher, signaling an excess of sellers. Grasping these concepts is crucial for traders aiming to make informed decisions.
The identification and interpretation of these levels allow traders to predict possible entry and exit points, offering insights into the potential continuation or reversal of trends. This understanding stems from observing past price actions where prices have historically halted and changed direction. The rationale behind this is not solely technical but also psychological, as traders collectively remember these price points, acting upon them when they reappear.
Moreover, support and resistance levels are not static and can shift over time, transforming their roles. For instance, once a resistance level is breached, it can become a new support level, and vice versa. This dynamism requires traders to continuously monitor and adjust their strategies, making a thorough understanding of these levels indispensable for successful trading in the Forex market.
Importance of support and resistance levels in Forex trading
The significance of support and resistance levels in Forex trading cannot be overstated. They are tools that enable traders to make sense of market movements and predict future price actions with higher probability. By identifying these levels, traders can discern potential points where the market may pause or reverse, offering opportunities for entry or exit. This anticipation relies on historical price behavior, providing a strategic advantage.
Furthermore, Key levels assist traders in managing risk. By recognizing these levels, traders can set stop-loss orders to limit potential losses should the market move against their positions. Similarly, understanding these levels helps in setting realistic profit targets, ensuring traders can secure gains before the market potentially reverses.
Lastly, these levels play a pivotal role in the development of trading strategies. Whether a trader prefers range trading, breakout strategies, or trend following, support and resistance levels provide the foundation for these approaches. They help in defining trading ranges, spotting breakout points, and identifying potential trend continuations or reversals, making them indispensable for informed strategy formulation.
Identifying support and resistance levels on Forex charts
Identifying support and resistance levels on Forex charts is a skill that traders develop with experience and practice. The first step involves scrutinizing historical price data to locate points where the price has consistently stopped and changed direction. These points, marked on the charts, signify potential support or resistance levels.
Traders utilize various tools and indicators to aid in this identification process. Horizontal lines drawn at previous low and high points are a simple yet effective way to visualize these levels.
Additionally, trendlines, drawn connecting successive peaks or troughs, can act as dynamic support or resistance levels, adapting to the market’s movements.
The use of technical indicators, such as moving averages, can further enhance this identification. For instance, a moving average can serve as a dynamic level of support in an uptrend or resistance in a downtrend, providing a more nuanced view of the market’s direction and momentum. Traders combine these techniques, refining their analysis to pinpoint more accurately the levels at which the market might react.
Different types of support and resistance levels
In Forex trading, support and resistance levels are not one-dimensional. There are several types, each offering unique insights into market dynamics. The most straightforward are horizontal support and resistance, identified by flat lines connecting price points where the market has previously turned.
Dynamic support and resistance levels introduce a temporal element, adjusting over time with the market’s movements. These are often represented by moving averages, where the moving average line itself acts as a level that the price may struggle to break through.
Psychological levels represent another category, stemming from human behavior and market sentiment. These are price levels ending in round numbers or significant figures, such as .00 or .50, where traders often place orders. The market’s reaction to these levels is driven by collective human psychology, making them potent areas of interest.
Lastly, pivot points, calculated using the previous period’s high, low, and close prices, offer a predictive method of identifying potential support and resistance levels for the trading day ahead. These levels, encompassing standard pivot points and their extensions, provide a framework within which traders can gauge market sentiment and potential price movements.
How to draw support and resistance levels accurately
Drawing Key levels accurately is fundamental for effective Forex trading. The process begins with a clean chart, free from excess indicators that might cloud judgment. Traders then scan historical price data, marking the points where prices have shown significant turns or pauses.
When plotting horizontal levels, it’s essential to look for areas where the price has bounced several times, indicating strong market sentiment. The accuracy improves with the number of touches, as more points of contact validate the level’s significance. It’s also crucial to remember that these levels are zones rather than precise lines, allowing for a buffer where the market might test the levels.
For dynamic levels, such as those provided by moving averages, choosing the right period is key. Short-term traders might opt for shorter moving averages, while long-term traders may prefer longer ones, each serving different strategic purposes. The slope of these moving averages can also indicate the strength of support or resistance, with steeper angles suggesting stronger levels.
Drawing trendlines requires connecting at least two highs or lows, with more points offering stronger validation. The aim is to capture the market’s momentum and direction, providing insights into potential future support or resistance areas as the price interacts with these lines.
Using support and resistance levels in Forex trading strategies
Incorporating support and resistance levels into Forex trading strategies offers traders a structured approach to market analysis and decision-making. One common strategy is range trading, where traders capitalize on prices moving between established support and resistance levels, buying at support and selling at resistance.
Breakout strategies represent another approach, where traders look for the price to break through a known level of support or resistance, signaling a potential new trend. Entry points are identified based on the breakout’s direction, with stop-loss orders placed just outside the broken level to protect against false breakouts.
Trend-following strategies also rely on support and resistance levels, particularly dynamic ones like moving averages. Traders use these levels to identify potential entry points in the direction of the trend, offering a method to ride the momentum until it shows signs of reversal.
Factors that influence support and resistance levels
Several factors influence the formation and strength of support and resistance levels in Forex trading. Market volume plays a significant role, as higher volumes at a particular level indicate stronger interest, making the level more likely to hold. Similarly, the number of times a level has been tested without being breached adds to its strength, as repeated tests reinforce the level’s significance.
Economic indicators and news releases can also impact these levels, as they introduce volatility and can lead to sudden market movements. Traders must stay informed about upcoming events and adjust their strategies accordingly, as these can lead to the creation of new levels or the breaking of existing ones.
Lastly, trader psychology and collective market sentiment contribute to the formation of support and resistance levels. Psychological levels, in particular, highlight how human behavior shapes market dynamics, with prices often reacting strongly to these perceived barriers.
Common mistakes to avoid when trading support and resistance levels
When trading support and resistance levels, several common mistakes can undermine a trader’s success. One such error is treating these levels as absolute rather than indicative zones. Markets can test and breach these levels before reversing, so flexibility in interpretation is key.
Another mistake is overlooking the significance of market context. Not all support and resistance levels carry the same weight, and their importance can vary based on broader market trends or conditions. Traders should prioritize levels that align with other indicators and market sentiments.
Neglecting risk management is also a critical oversight. Even when trading with well-defined support and resistance levels, the market can move unpredictably. Setting appropriate stop-loss orders and managing position sizes are essential practices to limit potential losses.
Advanced techniques for analyzing support and resistance levels
Beyond the basics, several advanced techniques can enhance a trader’s analysis of support and resistance levels. Fibonacci retracement levels, derived from the Fibonacci sequence, offer a mathematical approach to identifying potential levels based on previous market movements. These levels, particularly the 38.2%, 50%, and 61.8% retracement points, are often closely watched by traders.
Candlestick patterns, when combined with support and resistance levels, provide additional insights into potential market reversals or continuations. Patterns such as the hammer, engulfing, and doji indicate shifts in market sentiment that can signal entry or exit points in conjunction with these levels.
Another advanced method involves the use of volume indicators alongside support and resistance levels to gauge the strength of market interest. High volume at a support or resistance level suggests a strong market reaction, potentially validating the level’s significance.
Conclusion: Mastering support and resistance levels in Forex
Mastering Key levels Forex trading is a journey that requires patience, practice, and continuous learning. These levels provide a framework within which traders can analyze market movements, predict price actions, and devise strategies. By understanding the underlying concepts, accurately identifying these levels, and applying them within the context of a comprehensive trading strategy, traders can enhance their market analysis and decision-making capabilities.
The key to success lies in the disciplined application of these concepts, combined with effective risk management and ongoing market analysis. As traders gain experience, they can incorporate advanced techniques and adapt their strategies to the ever-changing Forex market, striving for consistent performance and improved trading outcomes.
Read now to deepen your understanding of support and resistance levels in Forex and refine your trading strategies for better results.