
Candlestick patterns trace their roots to Japanese rice trader Munehisa Homma from the 1700s. These powerful technical analysis tools have guided traders to identify potential market movements for more than a century. Some patterns prove remarkably accurate with 82% success rates in predicting market reversals.
Research studies confirm the high reliability of reversal candlestick patterns consistently. The bearish engulfing pattern delivers a 72% success rate in predicting downward reversals. The three white soldiers pattern stands out with an 82% accuracy rate for bullish reversals. Traders who master bullish and bearish candlestick patterns can expect 50-60% average success rates, making these patterns excellent indicators of market turning points.
This piece explores the most dependable candlestick reversal patterns and shows you the correct way to spot them. You’ll learn to confirm these signals under real-life trading conditions. The knowledge shared here will help both technical analysis beginners and experienced traders improve their trading strategy by discovering potential market reversals through these proven patterns.
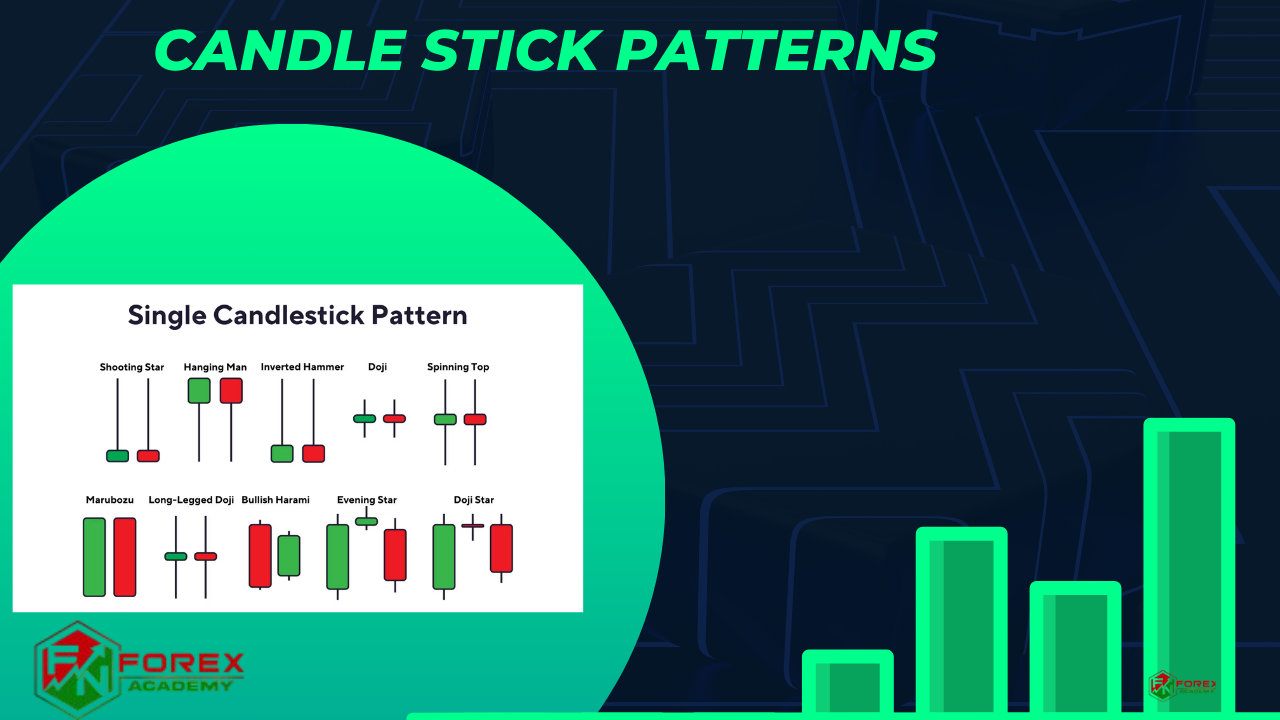
Understanding Essential Reversal Candlestick Patterns

Image Source: FBS
Reversal candlestick patterns are vital indicators in technical analysis that suggest potential directional price changes. Traders can use these formations to enter or exit positions when the current trend starts losing momentum and before the market changes direction.
A candlestick’s structure captures four key price points: open, close, high, and low. The candlestick’s rectangular body shows the range between opening and closing prices. Its shadows (or wicks) stretch above and below to mark the period’s highest and lowest prices. Strong buying or selling pressure creates long bodies, while short bodies reflect market indecision.
Reversal patterns fall into two main categories:
- Bullish reversal patterns: These patterns emerge when downtrends end and signal potential upward price moves. The hammer, bullish engulfing, bullish harami, and morning star are common examples.
- Bearish reversal patterns: These formations appear at uptrend endings and point to possible downward price movements. The hanging man, shooting star, bearish engulfing, and evening star are popular examples.
Market psychology’s understanding gives traders deeper insights into pattern behavior. A bullish engulfing pattern shows buyers overwhelming sellers completely. The larger bullish candle “engulfs” the previous bearish one, which demonstrates the market sentiment’s clear shift from selling to buying pressure.
The evening star pattern appears at uptrend peaks and consists of three candlesticks. This pattern reveals buying momentum’s gradual weakening before sellers take control. The pattern starts with strong buying, followed by indecision in the second candle, and ends with strong selling pressure that confirms the reversal.
Single-candle patterns like the hammer or hanging man pack equal power. The hammer’s small body and long lower wick tell a compelling story. Sellers drive prices lower initially, but buyers end up pushing prices higher by the session’s close – a strong signal that the trend might reverse.
Top Bullish and Bearish Candlestick Patterns for Reversals

Image Source: Tech Quality Pedia
Traders who know how to use reversal candlestick patterns have a big advantage in spotting market turning points. Let’s get into the most reliable patterns that show possible trend changes.
The Doji pattern shows up when opening and closing prices are almost similar. It creates a cross-like shape that points to market indecision. This pattern becomes really powerful at trend extremes and can signal an upcoming reversal. A string of dojis in a row makes the reversal more likely.
Hammer patterns pop up at downtrend bottoms. They have small bodies near the top and long lower shadows that stretch at least twice the body’s length. This shows that sellers pushed prices down at first, but buyers ended up taking control. Hammers show approximately 62% success rate in predicting bullish reversals.
The Inverted Hammer also appears at downtrend bottoms but looks like an upside-down hammer with a long upper shadow. This pattern shows that traders strongly rejected lower prices and has about 65% success in predicting bullish reversals.
Bullish Engulfing patterns happen when a larger bullish candle completely covers the previous bearish candle’s body. This two-candle setup shows up at downtrend bottoms and works about 65% of the time. Its opposite, the Bearish Engulfing, forms at uptrend peaks when a bearish candle covers the previous bullish one.
The Morning Star stands out among three-candle patterns with about 65% accuracy in spotting bullish reversals. A strong bearish candle comes first, then a small indecision candle, followed by a strong bullish candle. The Evening Star forms at uptrend peaks and signals bearish reversals with about 69% success.
These patterns work even better when they show up near key support or resistance levels. Traders should watch for them carefully in these areas.
How to Confirm Candlestick Reversal Patterns in Real Trading

Image Source: Strike.money
Candlestick patterns show their true power when traders combine them with proper confirmation techniques. Pattern recognition alone often creates false signals and poor trading decisions.
Traders consider volume analysis their most vital confirmation tool. A reversal pattern with a volume spike (2-3x above average) improves its reliability substantially. To name just one example, a bullish engulfing pattern that forms with high volume shows strong buying interest and makes the reversal signal stronger.
Support and resistance levels add another layer of confirmation. Reversal patterns carry much greater weight when they form at established support or resistance zones compared to other locations. A hammer appearing at a long-established support level increases the probability of a successful bullish reversal dramatically.
Daily candlestick patterns produce the best results, especially when you have short-term trading periods of 1-10 days. Higher timeframes naturally filter out market noise and make patterns more reliable.
Signals become stronger through multiple timeframe analysis. Traders should verify if patterns line up with trends on higher timeframes before taking action. The process needs analysis of at least three timeframes – spot the overall trend on the highest timeframe, verify the reversal on the intermediate timeframe, and perfect your entry on the lower timeframe.
The next step requires waiting for confirmation from subsequent candles after pattern formation. A bullish engulfing pattern needs the next candle to close higher, which proves buyers maintain control.
Technical indicators serve as additional filters to complete the strategy. Volume patterns, moving averages, or momentum oscillators help verify the reversal signal’s strength. Note that candlestick patterns work best as part of a detailed trading strategy rather than standalone signals.
Conclusion
Candlestick patterns are powerful tools that help identify market reversals. These patterns combine centuries of trading wisdom with modern statistical verification. Success rates ranging from 50-82% show how reliable these patterns can be when traders identify and confirm them properly.
These patterns reflect market psychology through various formations. Single-candle patterns like hammers and complex three-candle patterns like evening stars each tell a unique story. Their real value comes from proper confirmation methods.
Successful pattern trading depends on several key principles:
- Multiple timeframe analysis verifies signals
- Volume should surge 2-3 times above average
- Subsequent candles must confirm the pattern
- Patterns work best near support/resistance levels
- Other technical indicators strengthen pattern signals
Traders get the most reliable results on daily timeframes, particularly for short-term trading windows of 1-10 days. This strategy helps spot potential market reversals before major price movements happen. Pattern recognition and confirmation strategies make this possible.
Learning candlestick patterns takes practice and patience. Disciplined confirmation techniques are essential. The best approach is to start small with a few reliable patterns. Your pattern recognition skills will grow naturally as your confidence increases.
Wow very helpful
Wow very helpful