
Successful traders don’t just rely on individual asset analysis—they look at the bigger picture. One powerful tool for this is correlation analysis, which helps you understand how forex pairs and commodities move relative to each other. By mastering correlation, you can build smarter trading strategies, manage risk better, and uncover hidden opportunities.
What Is Correlation in Trading?
Correlation measures how two instruments move in relation to each other. In forex and commodities trading, understanding these relationships allows you to anticipate market behavior and avoid doubling your risk unintentionally.
👉 Correlation coefficient ranges:
- +1 (perfect positive correlation) – Both move in the same direction.
- 0 (no correlation) – Their movements are unrelated.
- -1 (perfect negative correlation) – They move in opposite directions.
Common Forex and Commodity Correlations
Here are some well-known correlations that traders watch:
🌟 EUR/USD and Gold (XAU/USD)
Often, both rise when the USD weakens.
🌟 AUD/USD and Gold (XAU/USD)
Since Australia is a major gold exporter, AUD tends to strengthen with gold prices.
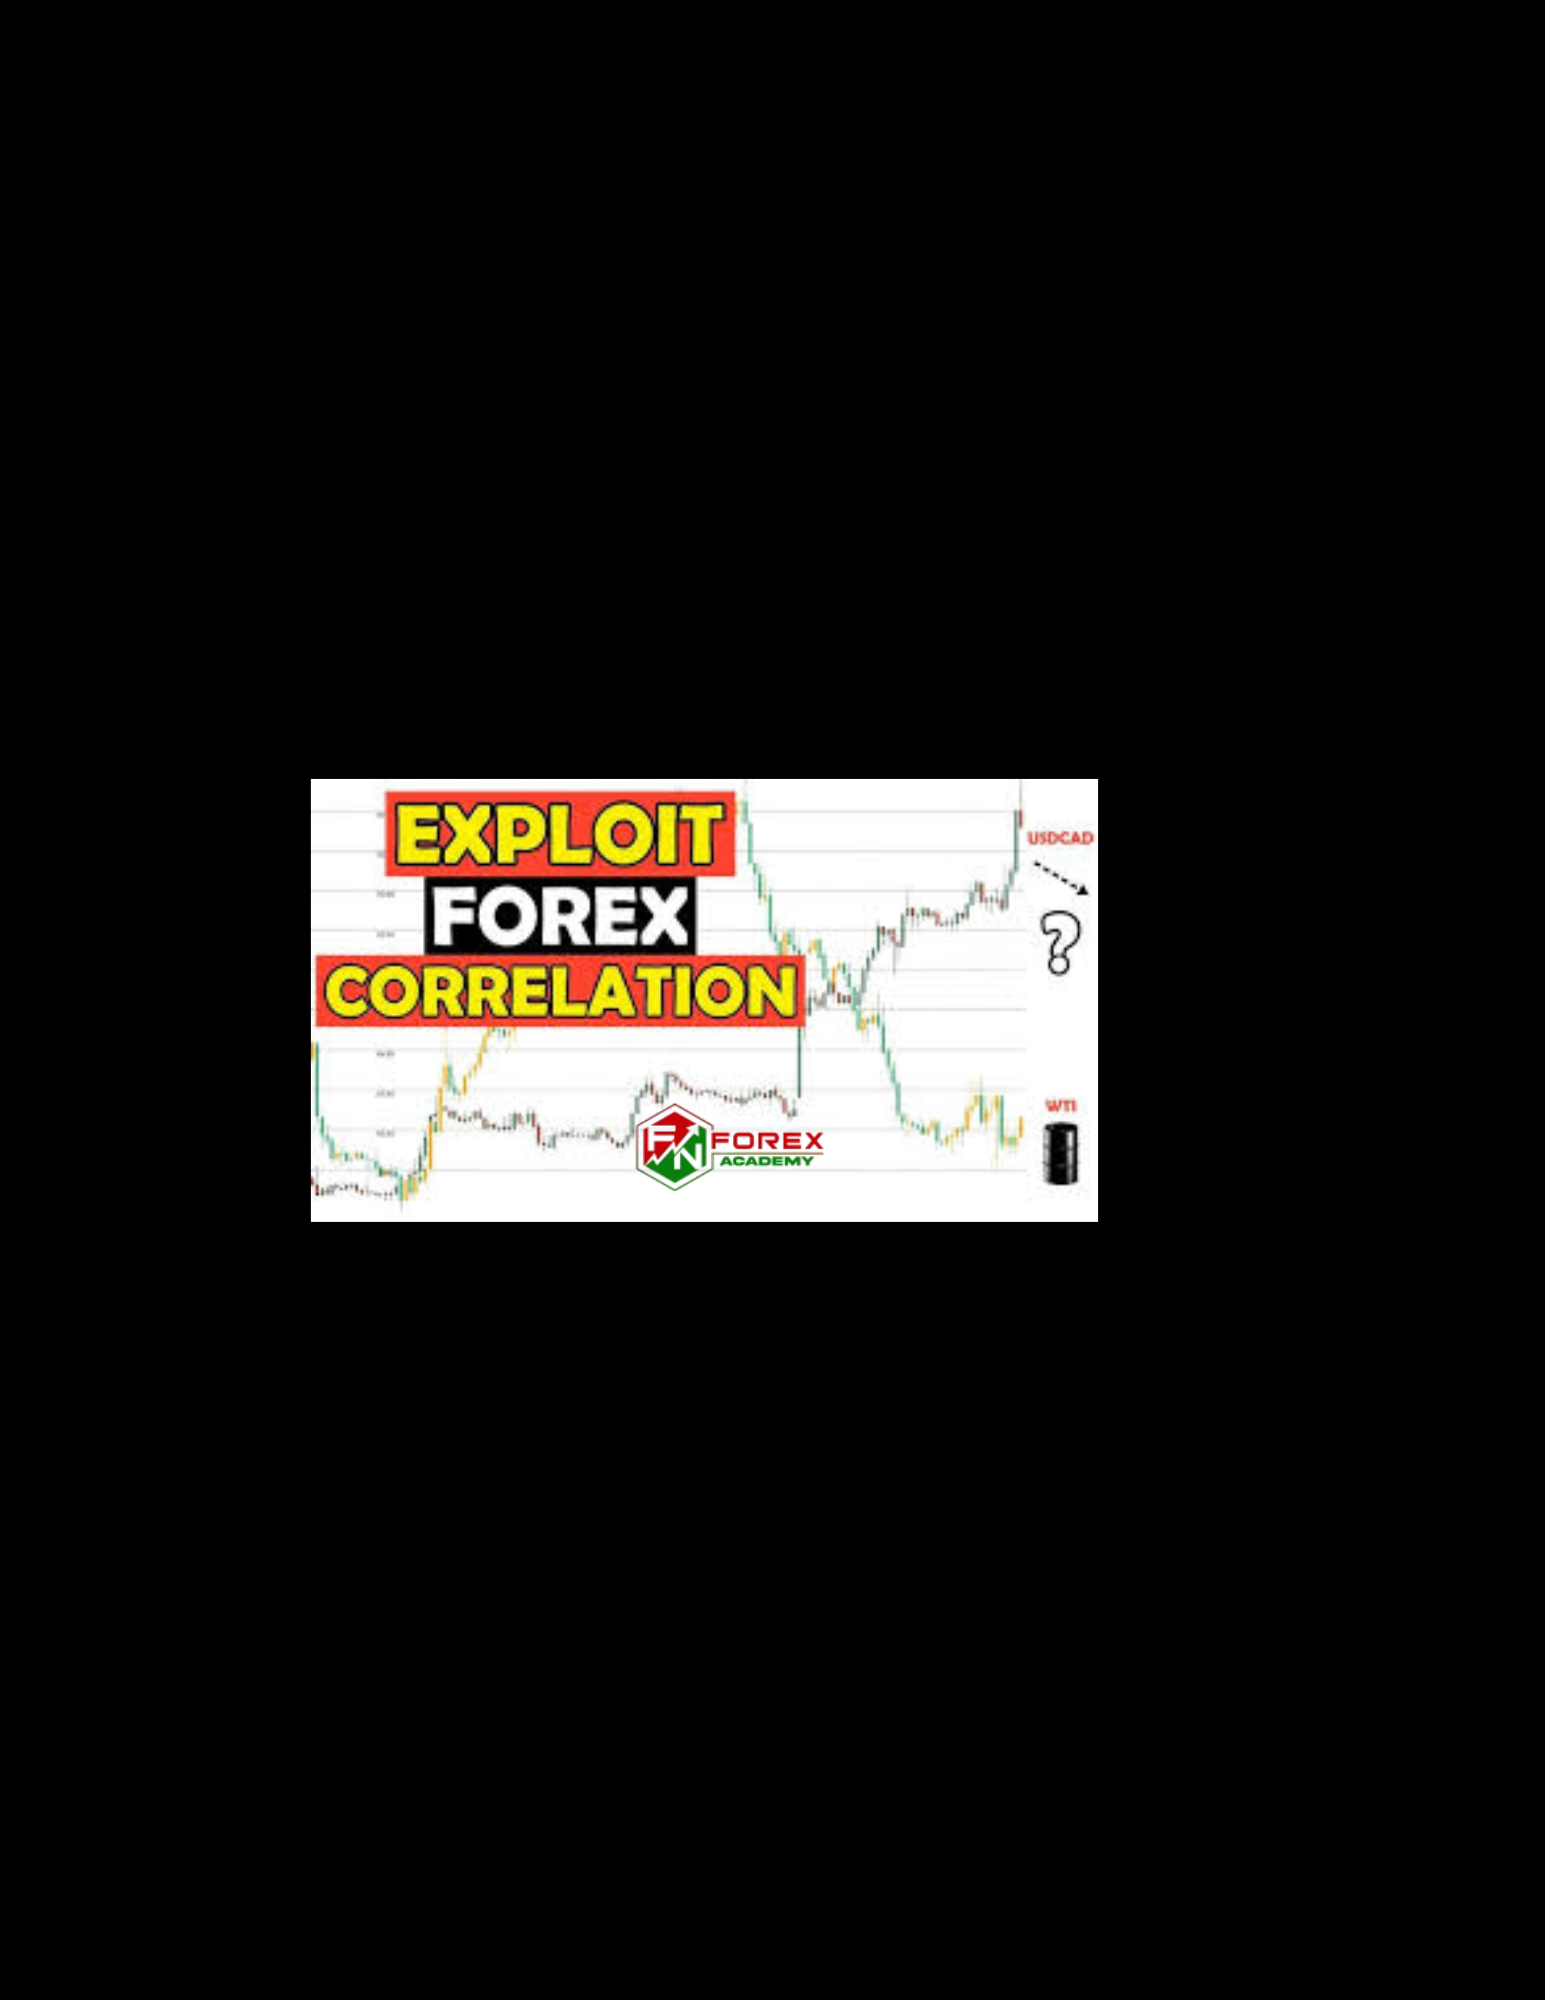
🌟 USD/CAD and Crude Oil (WTI)
Canada exports oil, so rising oil prices often strengthen the CAD, pushing USD/CAD lower.
🌟 USD/CHF and Gold
The Swiss franc is considered a safe-haven currency, and often correlates with gold in times of market uncertainty.
👉 Learn risk management for correlated trades: Position Size Calculator – FNForex
How to Apply Correlation in Your Trading Strategy
✅ Avoid overexposure
If you go long on multiple positively correlated pairs (e.g., AUD/USD and NZD/USD), you could be over-leveraging a single market view without realizing it.
✅ Hedge risk smartly
Trade negatively correlated pairs strategically. For example, pairing a long EUR/USD with a short USD/CHF during USD weakness.
✅ Confirm signals
Use correlation as an additional confirmation. If you’re bullish on gold, and AUD/USD is also showing bullish structure, this adds confidence to your trade.
✅ Monitor changes over time
Correlations can shift due to economic factors. Review them periodically rather than assuming they’re fixed.
👉 Related: The Impact of Leverage: A Double-Edged Sword in Forex
How to Measure Correlation
📌 Use correlation tables (many brokers and trading tools provide these).
📌 Apply custom Excel sheets or trading platform indicators to calculate correlation coefficients over different periods (30-day, 90-day, etc).
📌 Watch for shifts in correlation strength as market fundamentals change.
👉 Explore further: How to Identify Your Trading Style: Scalper, Day Trader, or Swing Trader?
Potential Risks of Using Correlation
⚠ Correlation is dynamic — Just because two assets were correlated last month doesn’t mean they will be this month.
⚠ False sense of diversification — Trading correlated assets can make you think you’re spreading risk when you’re not.
⚠ Overcomplication — Beginners can get overwhelmed trying to manage too many correlation-based trades.
👉 Related: The Dangers of Overtrading: How to Maintain Balance
External Resources to Explore
Suggested Images for This Article
✅ Correlation matrix table (e.g., forex pairs and commodities)
✅ Overlay chart showing EUR/USD vs. gold price movements
✅ Infographic: How to read correlation coefficients
✅ Diagram showing a hedging setup using correlated pairs
Final Thoughts
Correlation analysis is a powerful way to enhance your trading decisions—but it’s not a standalone strategy. Combine correlation insights with solid technical and fundamental analysis, and always manage your risk carefully. The smartest traders use correlation as part of a well-rounded approach to the markets.