
Introduction
Forex chart patterns are essential tools in technical analysis, offering insight into potential future price movements. These patterns form based on repetitive market psychology, giving traders a statistical edge when entering or exiting trades. This guide breaks down six of the most important reversal patterns:
- Head and Shoulders
- Inverse Head and Shoulders
- Double Top
- Double Bottom
- Triple Top
- Triple Bottom
We’ll also explain entries based on the neckline and confirmation using candlestick formations.
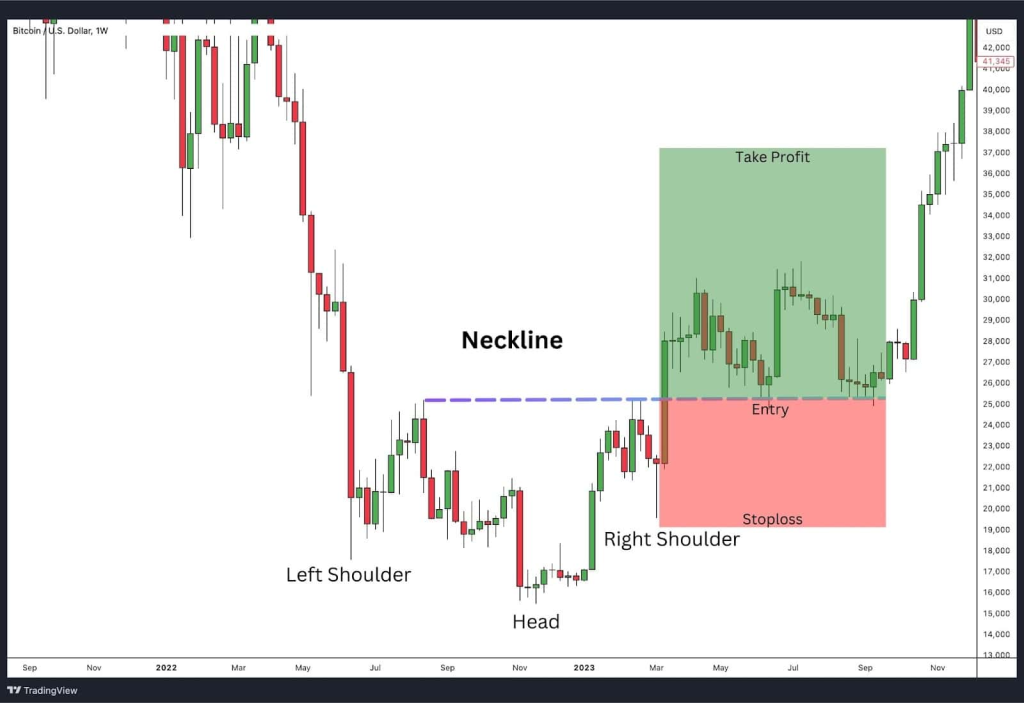
1. Head and Shoulders Pattern
This bearish reversal pattern occurs after an uptrend and signals a potential reversal.
Structure:
- Left Shoulder → a peak followed by a pullback
- Head → a higher peak
- Right Shoulder → a lower high
- Neckline → connects the lows between the shoulders
Entry Strategy:
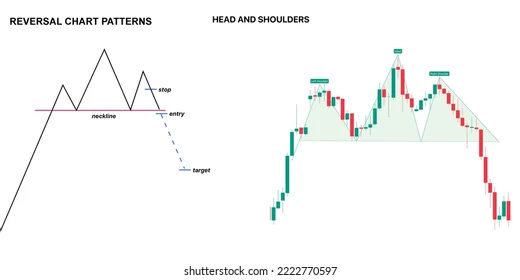
- Wait for a break and close below the neckline
- Look for bearish candlestick confirmation at the neckline: e.g., bearish engulfing, evening star
- Place SL above the right shoulder. To know more about this pattern, read the article below.
- Head and Shoulders Pattern Explained – BabyPips
🔷 2. Inverse Head and Shoulders
This is the bullish counterpart and often signals the end of a downtrend.
🧩 Structure:
- Inverse peaks forming the “head” and two shoulders
- The neckline connects highs between the dips
📈 Entry Strategy:
- Entry upon breakout above neckline (you can wait for a retest on the zone of breakout, especially if you are a conservative trader as seen in the image above).
- Look for bullish candles: hammer, bullish engulfing at breakout
- SL below the right shoulder
3. Double Top
A bearish reversal pattern appearing after a strong uptrend.
Structure:
- Two peaks at the same level
- Neckline forms from the low between peaks
Entry Strategy:
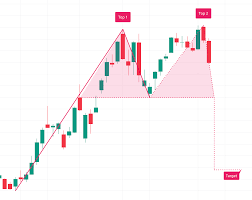
- Wait for break of the neckline
- Confirm with bearish candles like shooting star or bearish engulfing
- SL above the second top
4. Double Bottom
The bullish version of the double top.
Structure:
- Two troughs at the same support zone
- Neckline forms from the peak between lows
Entry Strategy:
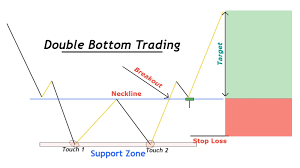
- Enter after breakout above the neckline
- Confirm with bullish candles: morning star, hammer
- SL below the second low
5. Triple TopThree failed attempts to break resistance—bearish reversal signal.
Entry Strategy:
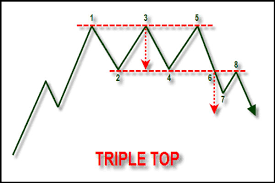
- Wait for neckline break
- Use a strong bearish candle for confirmation
6. Triple Bottom
A bullish reversal setup where price tests support three times and fails to break.
Entry Strategy:
- Entry above the neckline
- Confirm with a bullish engulfing or piercing pattern
Entry & Confirmation Checklist
| Action | Entry Signal | Candlestick Confirmation | Stop Loss |
|---|---|---|---|
| Head & Shoulders | Break below neckline | Bearish engulfing, evening star | Above right shoulder |
| Inverse H&S | Break above neckline | Bullish engulfing, hammer | Below right shoulder |
| Double Top | Neckline break | Shooting star, bearish engulfing | Above tops |
| Double Bottom | Neckline break | Morning star, bullish engulfing | Below bottoms |
| Triple Top | Neckline break | Bearish confirmation | Above resistance |
| Triple Bottom | Neckline break | Bullish confirmation | Below support |
You can check this other articles by me.
- Learn more about Reversal Candlestick Patterns:
👉 Understanding Candlestick Reversals – FNForex1.com - Deep dive into Price Action Strategy:
👉 Mastering Price Action – FNForex1.com
External Resources for Deeper Learning
- Chart Patterns Cheat Sheet – BabyPips
- Understanding Neckline Entries – TradingView
- Advanced Technical Patterns – Investopedia
Conclusion
Mastering chart patterns like Head and Shoulders, Double Tops, and Triple Bottoms provides a trader with a disciplined roadmap for entries and exits. Combine pattern recognition with candlestick confirmation, and you’ll greatly enhance your trading accuracy.