
The statistics are shocking – 95% of all traders ended up failing according to Elliott Wave theory. This fact explains why new traders need to pick the right approach from day one. Ralph Nelson Elliott developed this technical analysis method in the 1930s, and it has become one of the most talked-about trading frameworks.
Many new traders ask us if Elliott Wave theory works well enough for beginners. The approach needs traders to grasp a specific 5-3 wave pattern. Five waves move along the trend’s direction and three corrective waves follow. The method also uses Fibonacci ratios to spot potential support and resistance levels at 38.2%, 50%, and 61.8% retracements.
Price Action trading takes a different path. It looks at raw price movements without complex wave patterns. Some traders call Elliott Wave the ‘holy grail’ of financial markets. However, Price Action might give newcomers an easier starting point.
This piece breaks down both methods to help you pick what fits your trading style best. You’ll learn about their basic elements, real-world uses, and learning curves. This knowledge will help you choose between Elliott Wave’s well-laid-out patterns and Price Action’s straightforward approach.
Understanding the Basics of Elliott Wave and Price Action
The basis of Elliott Wave Theory comes from market psychology and its repetitive patterns. Ralph Nelson Elliott developed this approach in the 1930s. He saw market prices unfold in specific wave patterns that showed investors’ collective psychology. Market movements weren’t random but followed repetitive cycles driven by investor emotions – this observation became the life-blood of his analysis method.
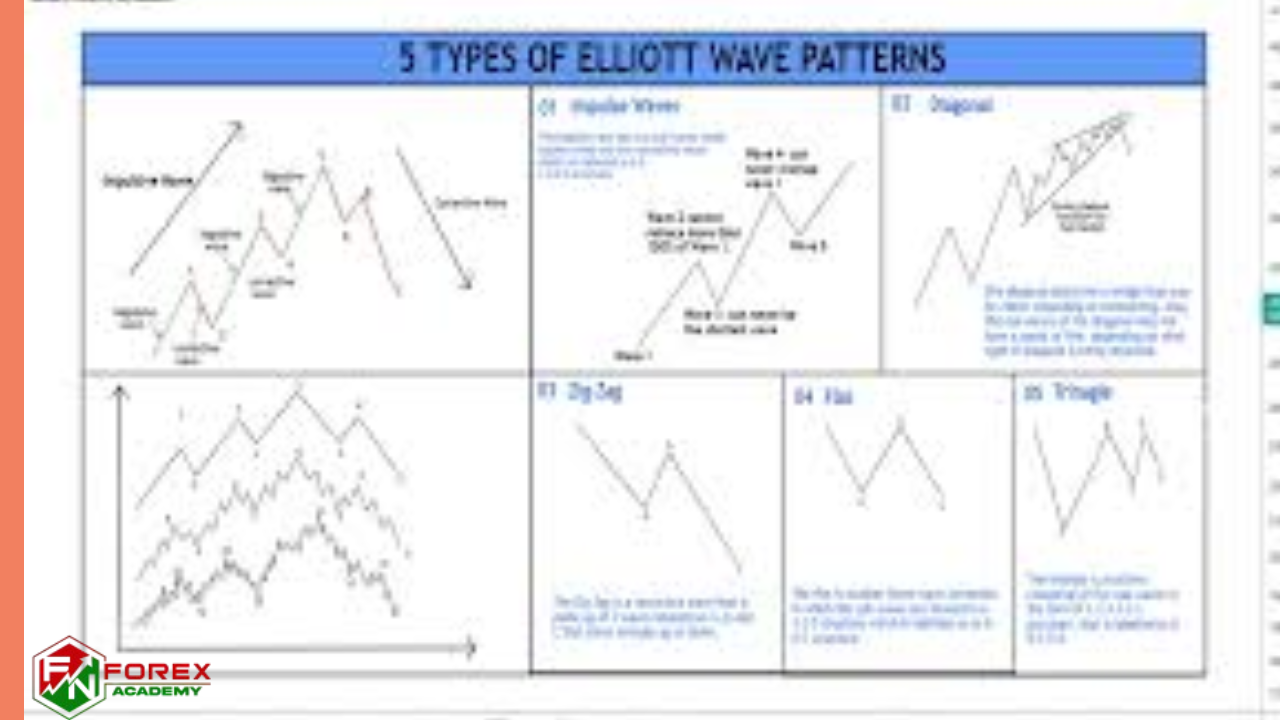
Impulse (motive) waves and corrective waves make up the two distinct wave types in Elliott Wave. These waves move with and against the trend respectively. The pattern shows five waves moving in the main trend’s direction and three corrective waves follow. Each impulse wave breaks down into five smaller-degree waves, and corrective waves split into three smaller-degree waves.
Price Action takes a purist’s view of trading that watches only the price movement itself. Price Action traders analyze raw price movements to make informed decisions instead of using complex indicators or wave counts. This method believes that price movement shows all market-influencing variables.
Price Action shines with its simplicity. Traders can watch price movements directly without complex indicators, which makes analysis straightforward. It also gives live insights that help make quick decisions based on recent market movements.
Both methods need subjective interpretation. Elliott Wave’s complexity leads to more varied analysis among traders. Price Action uses simpler price patterns that leave less room for different interpretations.
Elliott Wave traders often use Fibonacci relationships to improve prediction accuracy. Price Action traders focus on support/resistance levels, trendlines, and candlestick patterns. Your trading style and personality will influence by a lot which method fits better with your experience.
Core Components of Elliott Wave Theory
Elliott Wave Theory works with specific wave patterns and mathematical relationships. The foundation of this approach uses two main wave types: impulse (motive) waves and corrective waves. Together they create a complete cycle of eight waves.
Let’s take a closer look at impulse waves, which are the basic building blocks of market movement—they work like the “atoms” of price action. Each impulse wave must follow these strict rules:
- Must consist of five subwaves (labeled 1-2-3-4-5)
- Wave 2 never retraces more than 100% of Wave 1
- Wave 3 is never the shortest among waves 1, 3, and 5
- Wave 4 never enters the price territory of Wave 1
- Wave 5 typically ends with momentum divergence
Corrective waves move against the main trend and usually have three subwaves (labeled A-B-C). These waves can form various patterns like zigzags (sharp corrections), flats (sideways corrections), and triangles (consolidation patterns).
Fibonacci relationships play a crucial role in Elliott Wave analysis. This mathematical sequence (1, 1, 2, 3, 5, 8, 13, 21, 34, 55, 89…) forms the mathematical foundation for wave measurements. These specific Fibonacci ratios show up consistently:
- Wave 2 typically retraces 50%, 61.8%, 76.4%, or 85.4% of wave 1
- Wave 3 is often 161.8%, 261.8%, or 323.6% of wave 1
- Wave 4 commonly retraces 14.6%, 23.6%, or 38.2% of wave 3
Experienced analysts use these mathematical relationships to project potential price targets and reversal points. Elliott developed his theory before he found its connection to Fibonacci. Later, he realized that “The Fibonacci Summation Series is the basis of The Wave Principle”.
These patterns appear across multiple timeframes because of their fractal nature. Waves contain smaller waves that follow similar patterns. This creates a hierarchical structure that helps Elliott Wave practitioners identify market position and potential turning points.
How Price Action Differs in Practice
Price Action trading removes complexity and focuses on price movements without indicators or complex wave patterns. Many beginners find this minimalist approach easier to grasp compared to Elliott Wave’s theoretical framework.
Price Action is fundamentally different from Elliott Wave trading. It eliminates complex indicators and lets traders concentrate on raw price movements. The approach adapts to each market’s unique characteristics instead of forcing market data into a fixed model.
Elliott Wave theory sounds impressive but rarely works as expected in actual markets. The theory’s predicted 5-3 price movement often proves wrong because prices respond to multiple factors that create more complex patterns than suggested.
Price Action demonstrates versatility in trading environments:
- Adaptability: Works well in any market or timeframe without major changes
- Effectiveness: Serves day traders and long-term investors equally well
- Risk Management: Makes use of support and resistance levels, trend lines, and candlestick patterns to set clear stop-loss points
Price Action tends to react rather than predict market movements. Traders respond to current market conditions and focus on candlestick formations like Doji, Engulfing, and Harami patterns for precise signals instead of trying to forecast future movements through complex wave relationships.
Candlestick patterns tell a story of market sentiment during specific timeframes. These patterns reflect the battle between buyers and sellers and give explanations that don’t rely on complex theoretical frameworks.
Beginners who struggle with Elliott Wave’s complexity can understand market dynamics through Price Action without spending years learning theoretical patterns that may not appear consistently in trading.
Comparison Table
| Aspect | Elliott Wave Theory | Price Action |
|---|---|---|
| Complexity | Complex system with specific 5-3 wave structure and Fibonacci ratios | Simpler, minimalist approach that focuses on raw price movements |
| Core Components | – Impulse waves (5 waves) – Corrective waves (3 waves) – Fibonacci relationships | – Support/resistance levels – Trendlines – Candlestick patterns |
| Analysis Method | Predictive – attempts to forecast future movements through wave patterns | Reactive – responds to current market conditions |
| Pattern Structure | Strict rules with specific wave counts and Fibonacci ratios (38.2%, 50%, 61.8%) | Flexible patterns based on price movement and market sentiment |
| Implementation | Understanding complex wave patterns and mathematical relationships is needed | Direct analysis of price movements without complex indicators |
| Market Application | Results can be inconsistent – patterns don’t always show in ideal ways | Highly adaptable to any market or timeframe |
| Learning Curve | Steeper learning curve that takes years to learn | More available to beginners |
Conclusion
A close look at both trading approaches reveals a clear winner for beginners. Price Action provides a simpler way to start trading than Elliott Wave Theory. New traders can focus on what really matters instead of getting tangled in complex wave patterns and mathematical relationships.
Elliott Wave still brings value to the table. Of course, it gives traders a detailed framework to understand market psychology. Many traders blend techniques from both methods as they grow in their trading experience. Elliott Wave’s fractal patterns can add extra insight once you’ve got Price Action basics down.
Your learning style should point you in the right direction. Price Action’s clear chart patterns might click better with visual learners. Analytical minds often gravitate toward Elliott Wave’s mathematical structure. Whatever path you pick, staying consistent matters more than the method itself.
Most beginners should start with Price Action fundamentals. Learn support and resistance, trend identification, and simple candlestick patterns first. You can always dive into Elliott Wave concepts later. This step-by-step approach helps build confidence through early wins and creates solid trading foundations.
Success in trading has nowhere near as much to do with your chosen theory as it does with discipline, risk management, and emotional control. Pick the approach that feels natural, and practice until you spot patterns without thinking. Elliott Wave might promise predictive powers, but Price Action gives beginners practical results they can use right away. This makes it your best bet to start your trading experience.