
In the world of candlestick charting, Doji candles are among the most insightful patterns, signaling a critical balance between buyers and sellers. Here’s your complete, problem‑solving guide:
What Is a Doji?
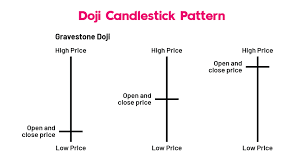
A Doji forms when a security’s opening and closing prices are virtually equal, producing a candlestick with a tiny—or nonexistent—body, typically resembling a cross, inverted cross, or plus sign (Investopedia, Wikipedia).
This structure reflects market indecision, effectively a stalemate between bullish and bearish forces (Babypips.com, Wikipedia).
Key Doji Variations & What They Mean
- Standard Doji
- Long‑Legged Doji
- Extended upper and lower wicks
- Deep indecision with extreme intra-session swings (NAGA)
- Dragonfly Doji
- Appearance: “T”-shaped (long lower shadow, open/close at high)
- Typically signals bullish reversal after downtrends (NAGA, Investopedia)
- Gravestone Doji
- Resembles an upside-down “T” (long upper shadow, open/close at low)
- Often signals bearish reversal after uptrends (Investopedia, NAGA)
When Doji Matters—and When It Doesn’t
- Effective when: Appearing at trend extremes, near support/resistance or after a strong directional move; suggests potential reversal or pause (Wikipedia, XS, LiteFinance).
- Less useful when: In sideways or choppy markets; Doji patterns alone provide limited directional insight (Babypips.com, Investopedia).
Trading Doji Candles: A Practical Framework
| Step | Action | Why It Helps |
|---|---|---|
| 1 | Identify Context: Confirm trend and locate key S/R levels | Only trade Doji where sentiment shift matters (NAGA, Wikipedia) |
| 2 | Wait for Confirmation: Look for follow-up candle in direction of anticipated move | Ensures the signal isn’t a false alarm (Investopedia) |
| 3 | Use Indicators: Combine with RSI, MACD, volume to reinforce the signal | Increases odds of capturing real moves (NAGA, Investopedia) |
| 4 | Manage Risk: Set SL beyond extreme wick; Target next S/R zone or defined projection | Maintain disciplined risk-reward balance |
Example Use Cases:
- A Dragonfly Doji at strong support with RSI oversold and bullish follow-through? Consider a long entry.
- A Gravestone Doji at resistance with declining volume and bearish confirmation? Consider a short.
Why Doji Patterns Work
They expose market reversal psychology: attempts to push price deeper into trend get rejected, showing that smart money is stepping in against the prior move (IG, Strike).
Summary: Doji Candlesticks at a Glance
| Doji Type | Structure | Typical Signal |
|---|---|---|
| Standard Doji | Small body, balanced wicks | Indecision; need context |
| Long‑Legged | Extra long shadows both sides | High uncertainty |
| Dragonfly | Long lower wick, little/no upper | Bullish (after downtrend) |
| Gravestone | Long upper wick, little/no lower | Bearish (after uptrend) |
Internal Resources You Might Like (FNForex1.com)
- Candlestick Reversal Secrets: Explore deeper confirmation methods and pattern timing.
- Support & Resistance Strategy Guide: Learn how Doji at key levels boosts your edge.
Final Word
Doji candles aren’t magic—they’re telltale signs of indecision and emerging reversals. Used alone, they’re ambiguous. But when aligned with trend structure, key levels, and confirmation—Doji patterns reveal high‑probability trading opportunities. Let me know if you want this adapted into a full SEO-friendly article with meta tags and structured headings!